
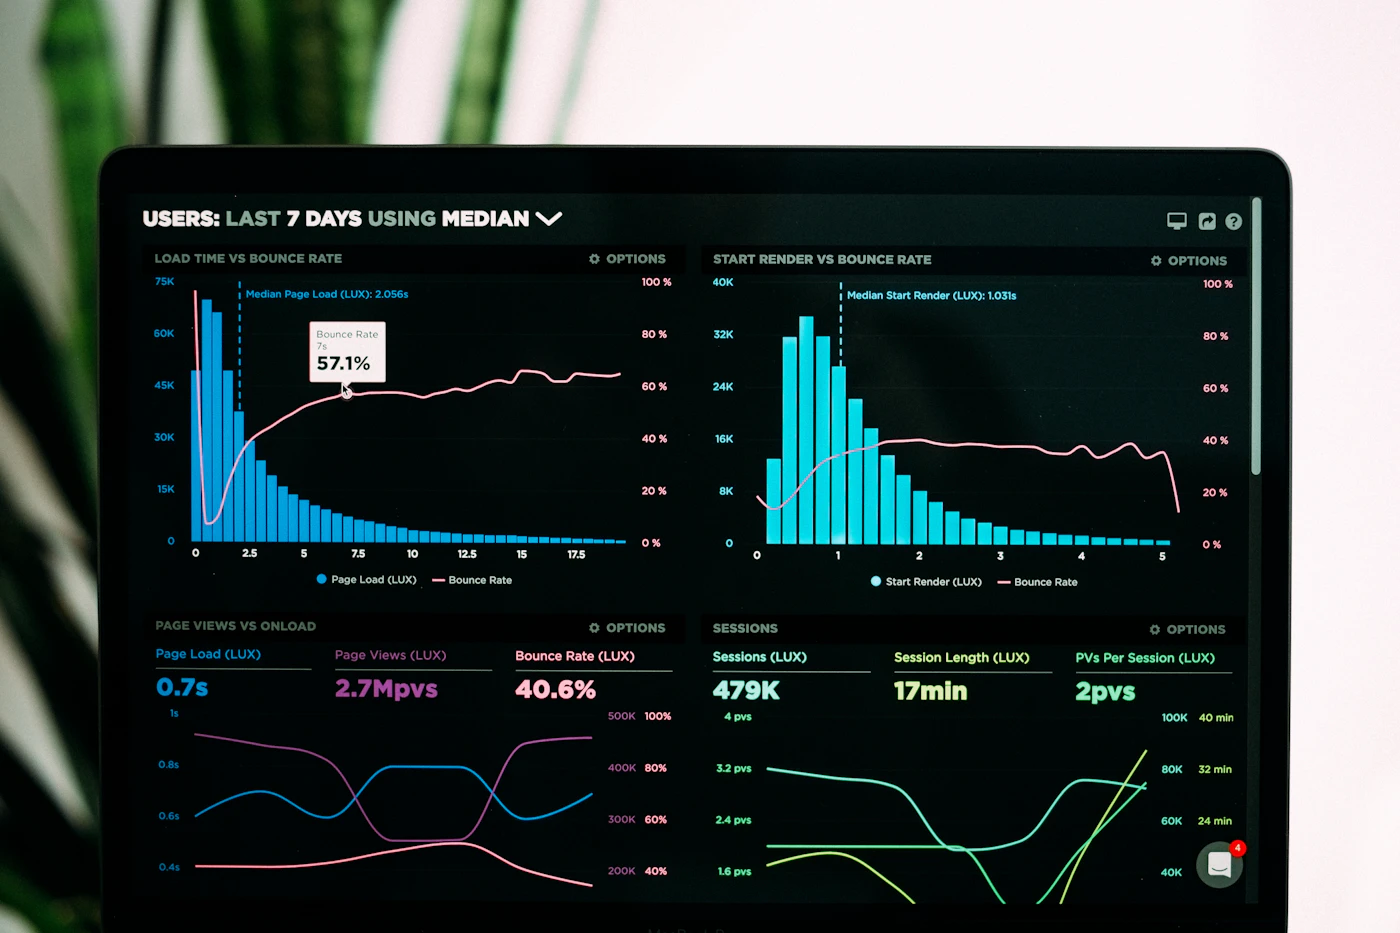
A dashboard is a conversation with data. The best ones answer the user's first question immediately and make the next question easy to ask.
Lead with the answer
Put the two or three numbers people check every morning at the top, with clear change indicators. Everything else is supporting detail and can live a scroll or a click away.
Reduce, then organise
More charts rarely mean more insight. Remove anything that does not drive a decision, then group what remains by task rather than by data source.
- Use consistent colour for meaning, not decoration.
- Label axes and units plainly.
- Make empty, loading and error states feel designed.
Make exploration progressive
Offer filters and drill-downs that start simple. Saved views and shareable links turn a one-off exploration into something the whole team can rely on.
Design for every screen
People check dashboards on phones between meetings. Prioritise the key metrics for small screens and keep touch targets generous.